Workload Tracking Across Athletic Arenas: Recovery Data Reveals Performance Links in Soccer, Basketball, Hockey and Baseball
Written by Sofia Hartmann · Aug 27, 2026
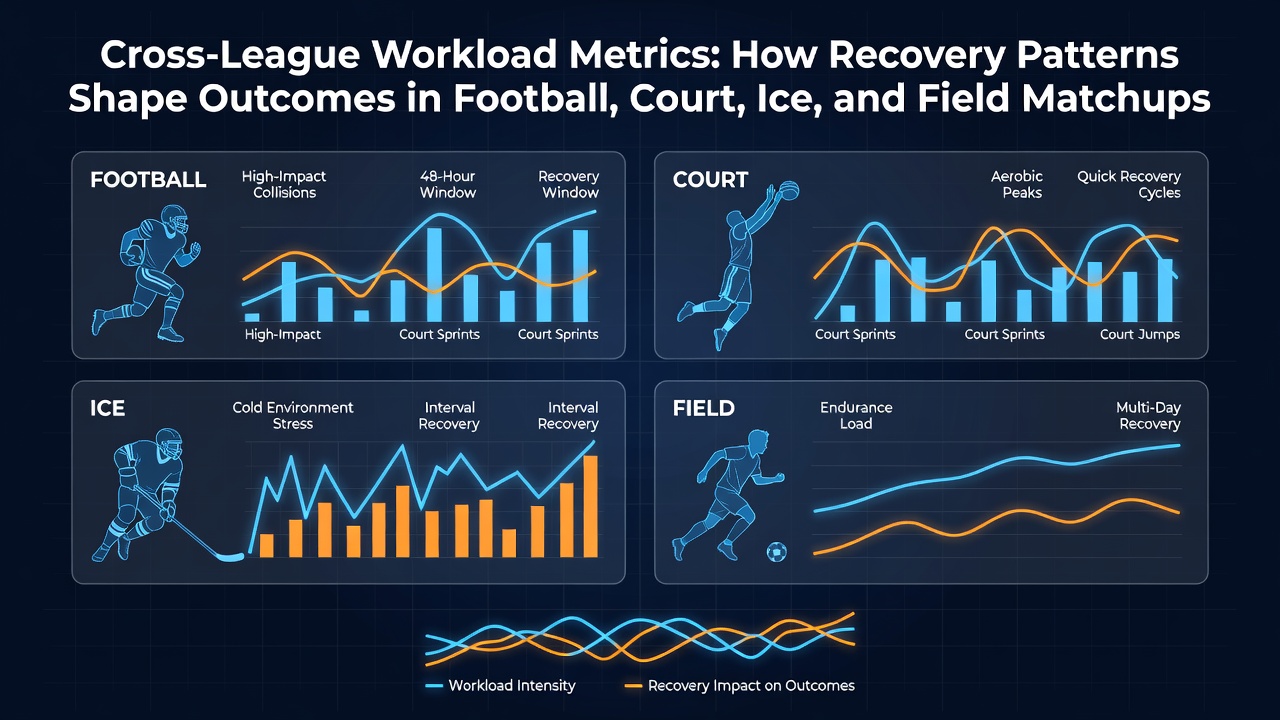
Workload Tracking Across Athletic Arenas: Recovery Data Reveals Performance Links in Soccer, Basketball, Hockey and Baseball
Teams in major sports leagues now rely on standardized workload metrics that combine GPS tracking, heart-rate variability readings, and sleep-cycle data to map how recovery influences game outcomes, and analysts in August 2026 continue to update models with fresh season statistics. Soccer clubs, basketball franchises, hockey organizations, and baseball squads each collect comparable figures yet apply them differently because field dimensions, game durations, and travel demands vary sharply between codes.
Soccer Pitch Demands and Recovery Windows
Elite soccer players log average weekly distances exceeding 40 kilometers during peak fixture periods, according to figures released by the Union of European Football Associations medical committee, and clubs that extend recovery intervals beyond 72 hours between matches record lower soft-tissue injury rates. Data collected from the 2025-26 campaign shows teams that monitor neuromuscular fatigue through countermovement jump tests maintain higher possession percentages in the final 15 minutes of games. European leagues introduced mandatory rest protocols after congested winter schedules, and those rules produced measurable drops in high-intensity running output when recovery fell below established thresholds.
Basketball Court Load Patterns
NBA and WNBA franchises track player-load units derived from accelerometer data, and studies published by the American College of Sports Medicine indicate that back-to-back games elevate next-day creatine-kinase levels by 25 percent on average. Teams that insert load-management minutes for rotation players during the regular season preserve higher fourth-quarter efficiency ratings once playoffs begin. Court surfaces and vertical jump frequency create distinct recovery signatures compared with field sports, which is why basketball organizations integrate daily wellness questionnaires alongside GPS totals to forecast minutes restrictions.
Ice Hockey Recovery Variables
National Hockey League clubs employ wearable sensors that record explosive skating efforts and collision forces, while research coordinated by the Hockey Research Group at the University of Calgary links shortened recovery periods to elevated concussion symptom scores. August 2026 training-camp testing already incorporates blood-flow-restriction protocols designed to accelerate return-to-play timelines after lower-body injuries. Because ice time per shift rarely exceeds 45 seconds, workload models focus on repeated high-intensity bursts rather than sustained distance, yet cumulative fatigue across three games in four nights still correlates with reduced save percentages among goaltenders who log the highest shot volumes.
Baseball Diamond Workload Metrics
Major League Baseball organizations rely on pitch-count algorithms and innings-pitched thresholds that have evolved since the implementation of the 2023 collective bargaining agreement, and data shared by the MLB Players Association shows that starters who receive five full days between outings post earned-run averages 0.45 runs lower than those on shorter cycles. Position players accumulate workload through sprint totals and swing counts tracked by Statcast, and teams that rest everyday catchers after night games followed by day travel report steadier on-base percentages across the final month of the season. August 2026 doubleheader schedules have prompted several clubs to publish internal recovery dashboards that combine biometric scores with historical injury tables.

Cross-Sport Comparisons and Shared Tools
Although surface and contact profiles differ, practitioners note that heart-rate-variability thresholds above 85 percent of baseline predict improved next-day output across all four codes, according to a multi-sport review issued by the International Olympic Committee consensus group. Travel across time zones disrupts circadian alignment in comparable ways whether squads fly from coast to coast for basketball or baseball or cross the Atlantic for Champions League fixtures. Organizations that standardize recovery scoring systems report fewer in-season roster adjustments, because objective markers allow medical staffs to intervene before subjective fatigue complaints surface.
Software platforms now aggregate data from multiple leagues into unified dashboards, and the resulting datasets reveal that soccer midfielders and hockey defensemen share similar weekly load ceilings before performance decay accelerates. Basketball forwards and baseball outfielders both exhibit elevated lower-limb stress after repeated lateral movements, prompting shared strength-and-conditioning templates between the leagues. August 2026 updates to these platforms include refined machine-learning layers that adjust recovery predictions based on venue-specific environmental readings such as humidity and altitude.
Conclusion
Workload metrics compiled across soccer, basketball, hockey, and baseball demonstrate consistent relationships between documented recovery intervals and measurable performance indicators, while August 2026 data streams continue to refine the thresholds used by performance staffs. Continued collaboration among medical researchers, league offices, and technology providers supports the ongoing integration of these tools into daily decision frameworks.