Weather Patterns Transforming Betting Dynamics Across Outdoor Sports and Racing
Written by Sage Vogel · Aug 15, 2026
Weather Patterns Transforming Betting Dynamics Across Outdoor Sports and Racing
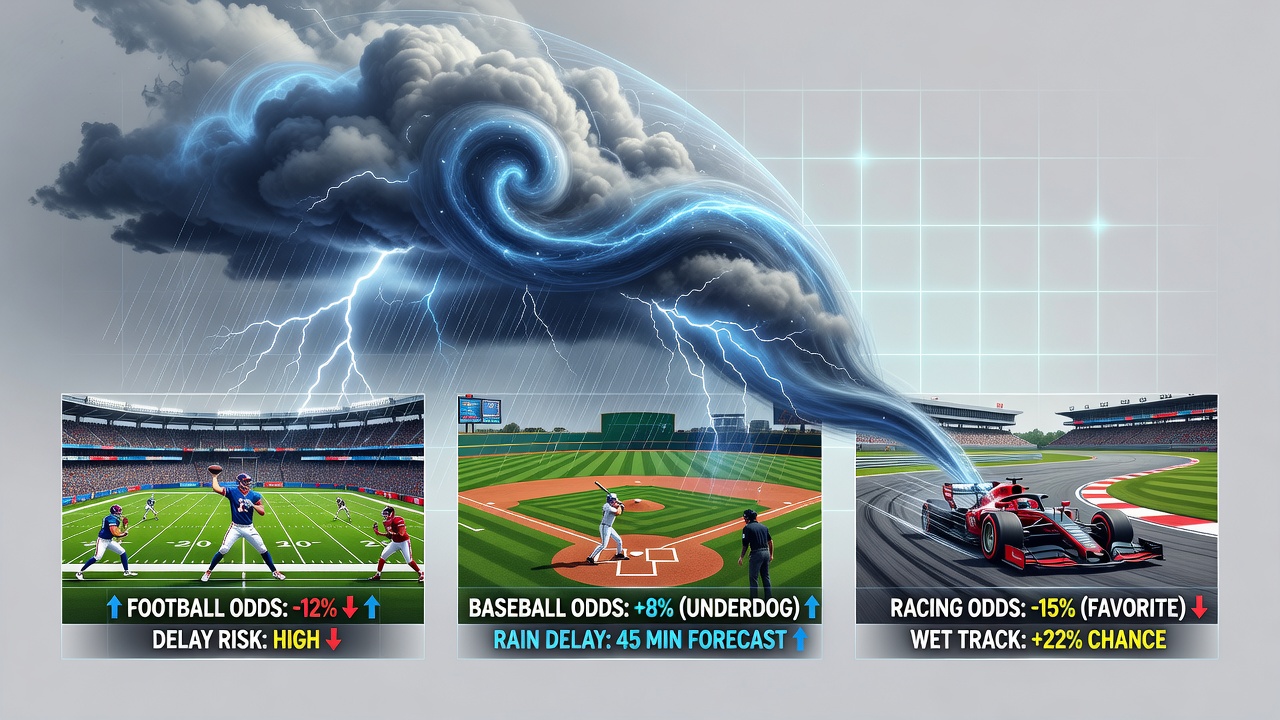
Weather fronts bring measurable changes to outdoor venues, and betting markets adjust lines accordingly as data accumulates from past events. Forecasters track pressure systems and temperature shifts that alter player performance metrics in football, baseball, and various racing formats, while oddsmakers incorporate historical correlations into their models. Observers note how these adjustments appear in real time across multiple sports during the same seasonal windows.
Frontal Systems in Football Matchups
Strong winds and precipitation fronts reduce passing efficiency in gridiron contests, and statistical records show completion percentages drop when sustained gusts exceed 15 miles per hour. Defensive units gain advantages under such conditions because quarterbacks face increased ball trajectory variance, which leads markets to move totals downward and adjust player prop lines for yardage categories. Rain events further complicate footing on natural surfaces, prompting bettors and operators to monitor ground game volume increases that appear in league data sets.
Temperature drops associated with cold fronts also influence stamina and injury rates, with studies from sports medicine databases indicating higher muscle strain incidents below 40 degrees Fahrenheit. Line movements reflect these patterns because historical averages demonstrate fewer explosive plays during late-season outdoor games in northern climates. August 2026 preseason schedules already include venues where early weather variability has prompted operators to widen totals ranges in advance of final numbers.
Baseball Pitching and Hitting Under Variable Conditions
MLB contests respond noticeably to humidity and wind direction because fly ball distances extend or contract depending on air density and tailwinds. Research from atmospheric science groups shows home run rates climb when temperatures rise above 80 degrees at certain parks, while cooler fronts suppress offense and shift run totals lower. Pitchers gain movement on breaking balls in drier air, and records indicate strikeout percentages rise under those circumstances.
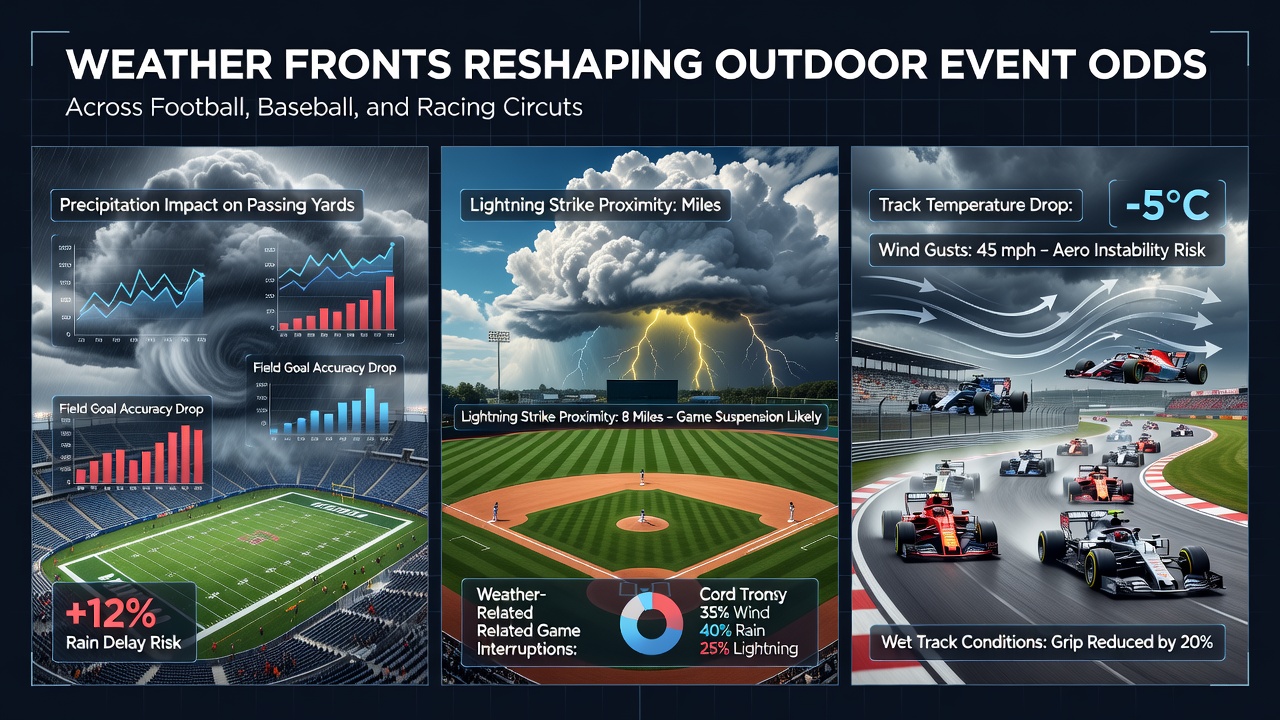
Precipitation delays create additional variables because bullpen usage increases after restarts, and data from multiple seasons reveals elevated walk rates in humid post-rain environments. Oddsmakers respond by adjusting moneyline odds for teams with fly-ball heavy lineups when forecasts call for opposing wind patterns. Those who track park factors incorporate live weather feeds to refine expected run environments before first pitch.
Racing Circuits and Track Surface Responses
Thoroughbred and harness events experience direct surface changes when rain fronts arrive, because track conditions shift from fast to sloppy and speed figures adjust accordingly. Handicappers review past performance data that demonstrates favorite win rates decline on sealed wet tracks, prompting place and show pools to reflect wider spreads. Temperature swings also affect equine recovery times between races, and veterinary reports note increased lameness incidents during rapid cooling periods.
Auto racing circuits face tire grip alterations when ambient temperatures fluctuate, with engineers adjusting setups based on forecast accuracy. Historical telemetry from events shows lap time variances of several seconds when cold fronts pass through, and betting exchanges update position markets to account for these mechanical edges. August 2026 schedules include several road courses where such variability has historically produced larger payout swings in exotic wagers.
Data Integration and Market Adjustments
Operators integrate National Weather Service grids with performance databases to generate probabilistic models, and industry reports from North American analytics firms indicate these inputs now influence opening lines more frequently than in prior decades. European regulatory summaries from gaming authorities highlight similar patterns in soccer and cycling events where wind and precipitation fronts alter possession and pacing statistics. Academic papers published through university sports science departments provide regression analyses that link specific atmospheric variables to outcome distributions.
Those monitoring line movements observe that sharp action often follows updated forecast revisions released 24 to 48 hours before events. teh reality is that multiple data layers converge to produce tighter spreads when weather certainty increases, while uncertainty widens ranges and boosts hold percentages across totals markets. Cross-referencing remains essential because regional climate differences produce distinct effects at each venue.
Conclusion
Weather fronts continue to supply quantifiable inputs that reshape odds across football, baseball, and racing circuits as datasets expand and modeling improves. Markets reflect these atmospheric influences through line adjustments derived from performance records and environmental correlations. Participants who review integrated forecasts alongside historical benchmarks gain access to information that shapes position sizing before events begin.