Seasonal Patterns Drive Shifts in Multi-Sport Metrics and Wager Strategies
Written by Zara Meier · Jul 21, 2026
Seasonal Patterns Drive Shifts in Multi-Sport Metrics and Wager Strategies
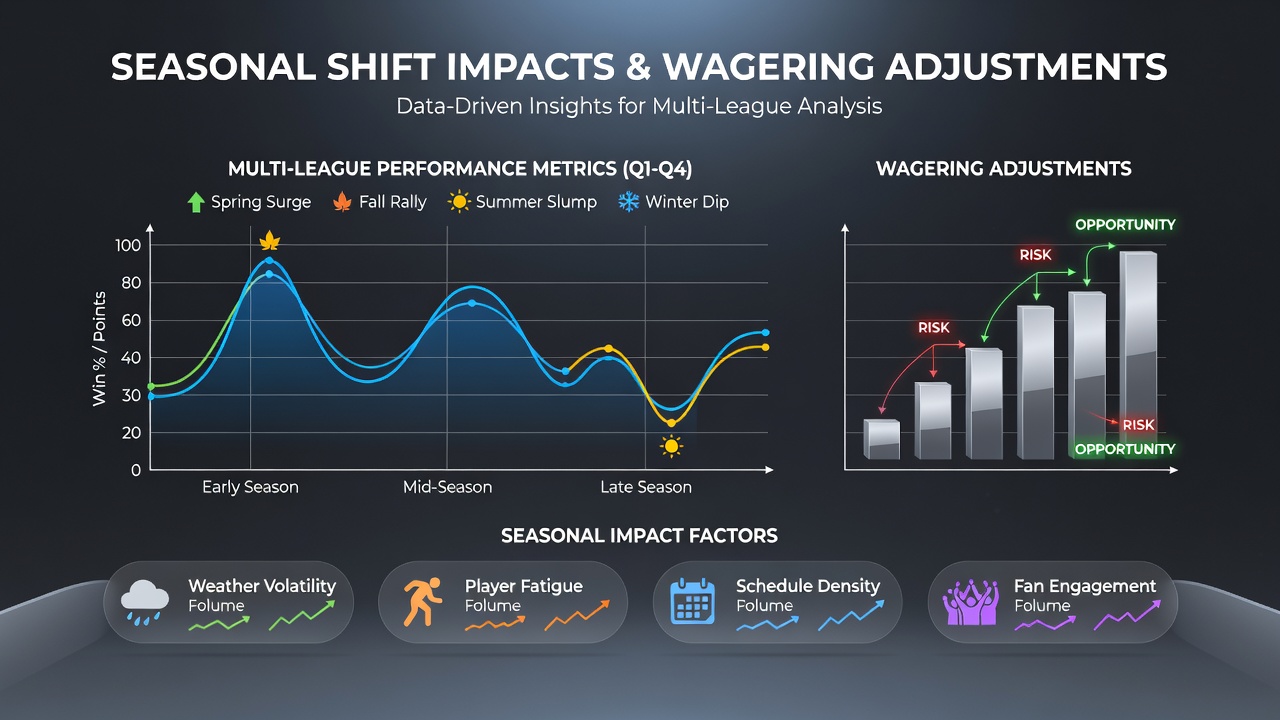
Seasonal transitions create measurable changes in athlete output across major leagues, and these patterns prompt corresponding adjustments in wagering markets. Data compiled through mid-2026 shows that performance indicators such as batting averages in MLB, shooting percentages in the NBA, and save percentages in the NHL fluctuate in consistent ways when teams move between early-season, mid-season, and late-season conditions. Bookmakers incorporate these historical trends when setting and moving lines, which leads to systematic shifts in odds throughout the calendar year.
Weather and Schedule Factors in Baseball and Hockey
MLB teams encounter distinct environmental variables as the season progresses from April into July and beyond. Research from the Australian Institute of Sport indicates that elevated temperatures and humidity levels in summer months correlate with modest increases in home-run rates while simultaneously reducing overall batting averages on the road. Pitchers experience corresponding drops in strikeout percentages during extended road trips through warm-weather cities, and these shifts appear in aggregated data sets released by league offices each July.
The NHL follows an opposite trajectory because its regular season spans the coldest months. Analysts tracking goaltender performance note that save percentages rise slightly in January and February compared with October figures, a pattern attributed to rink conditions and reduced travel fatigue after the holiday break. When the calendar reaches July 2026, front offices use these seasonal benchmarks to recalibrate expectations for the upcoming campaign, and betting markets adjust futures prices accordingly.
Travel and Load Management Effects in Basketball and Football
NBA schedules introduce back-to-back games and cross-country flights that intensify during the winter months. League tracking data reveal that teams playing three games in four nights post an average decline of 4.2 points in offensive efficiency, with the largest drops occurring between December and February. Wagering operators respond by shading totals downward for those specific matchups, and sharp bettors monitor rest advantages that become more pronounced after the All-Star break.
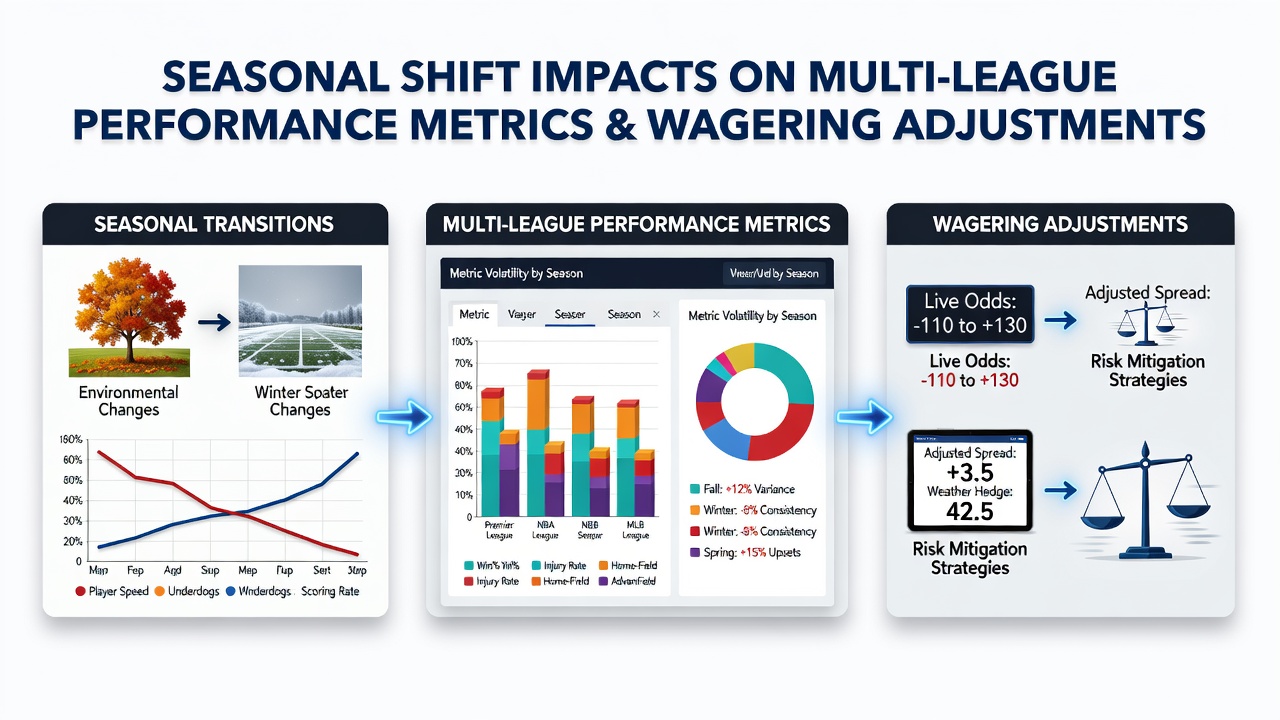
NFL teams face parallel challenges when late-season weather arrives. Cold-weather venues produce measurable reductions in passing-yardage totals during December and January games, according to figures compiled by the National Football League. Spreads and totals markets widen or contract in response, and these movements accelerate once playoff positioning solidifies. Observers note that the same statistical models applied across both leagues help identify value when public perception lags behind documented seasonal tendencies.
Cross-League Metric Comparisons and Market Reactions
Performance metrics borrowed from one sport sometimes inform analysis in another. Wins Above Replacement calculations developed for MLB have been adapted by NBA front offices to quantify player impact during compressed schedules, while NHL possession metrics find occasional use in soccer analytics. When these hybrid models incorporate seasonal weighting, they generate forecasts that differ from unadjusted projections. Betting exchanges reflect those differences through line movement that occurs within hours of model updates released in July each year.
Industry reports from the Canadian Gaming Association document increased handle on futures markets once seasonal data sets become available. Operators cite the need to balance action across early, middle, and late portions of each league calendar, which requires continuous recalibration of implied probabilities. The resulting odds reflect both on-field trends and the volume of wagers placed by bettors who follow or ignore historical seasonal patterns.
Data Releases and July 2026 Context
League statistical releases timed for early July provide fresh inputs for both performance models and wagering frameworks. In 2026 these reports include expanded tracking of player-load metrics and environmental variables that were previously unavailable. Markets for the following seasons open with initial lines that already embed these seasonal adjustments, and subsequent revisions occur as training-camp data arrive. Those who follow the releases observe that futures prices for teams with historically strong late-season records often move within the first week after publication.
Conclusion
Seasonal patterns produce consistent, quantifiable effects on performance metrics across multiple leagues, and wagering markets integrate those effects through ongoing line adjustments. Data from July 2026 releases continue to refine the models used by both teams and operators, which in turn shapes the odds available to bettors throughout each sport's calendar. The interplay between environmental conditions, schedule demands, and statistical outputs remains a central factor in how markets price future outcomes.