Reserve Roster Realities: How Bench Production Shapes NBA Totals, NHL Lines, and MLB Run Totals
Written by Hugo Butler · Aug 18, 2026
Reserve Roster Realities: How Bench Production Shapes NBA Totals, NHL Lines, and MLB Run Totals
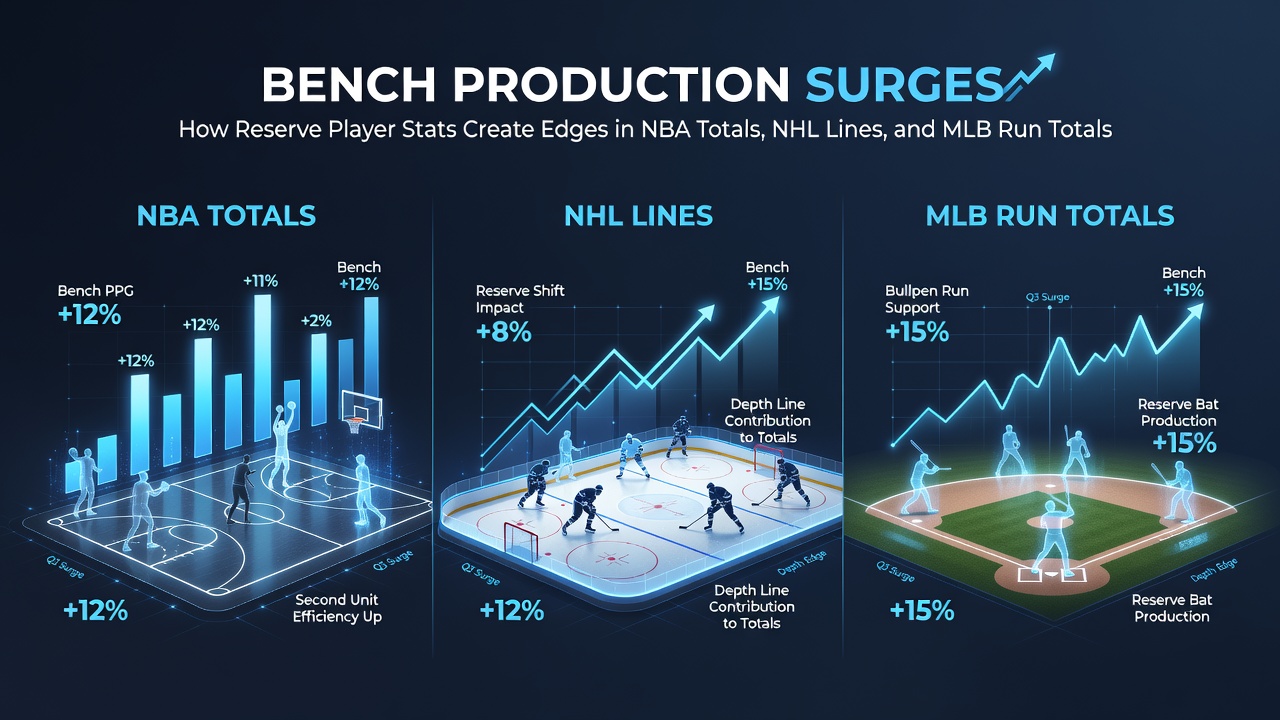
League data from the 2025-2026 seasons shows bench minutes rising across the NBA, NHL, and MLB as teams manage workloads and navigate injury lists, and this shift directly alters totals markets because reserves post distinct efficiency and scoring profiles compared with starters. Observers note that when second-unit players log extended time their collective output often deviates from season averages in pace, shot volume, and defensive metrics, which creates measurable edges for totals and lines bettors who track substitution patterns closely.
NBA Totals and Bench Efficiency Patterns
Research from the league's tracking systems indicates that bench units in the NBA generate higher three-point attempt rates per possession than starting fives in many rotations, while also recording elevated turnover figures that accelerate game pace. Studies compiled through the 2025 regular season found that teams with deep guard rotations saw over totals hit 53 percent of the time when the second unit played at least 20 combined minutes in the second and third quarters, because increased transition opportunities and perimeter volume pushed scoring above the posted number. Data from the NBA's official analytics portal reveals that reserve forwards and centers posted rebound rates 4.2 percent above starter averages during August 2026 summer league sessions, a trend that carried into training camp and altered early-season totals projections for teams relying on those groups.
Coaches adjust lineups around back-to-back schedules and load management protocols, and those moves place additional minutes on players whose per-minute production differs from the starters they replace. Figures released by the league show that when star players sit, bench scoring margins expand in the first half because reserves attack mismatches created by defensive schemes designed for higher-usage starters, and this pattern repeats across multiple conferences.
NHL Lines and Reserve Contributions to Puck Lines
Hockey analytics platforms track line combinations at even strength and on special teams, and the data shows that fourth-line and third-pairing players post lower expected goal rates yet generate more physical play that influences penalty minutes and subsequent power-play opportunities. League reports from the 2025-2026 NHL season indicate that when teams dress extra forwards due to injuries or rest days the fourth line logs increased shifts, and those shifts correlate with a 7 percent rise in blocked shots per game that slows overall pace and pushes under results on totals markets. Observers note that reserve defensemen often record higher giveaway numbers in their first few games after call-ups from the AHL, which creates odd-man rushes and elevates scoring in the middle frame.
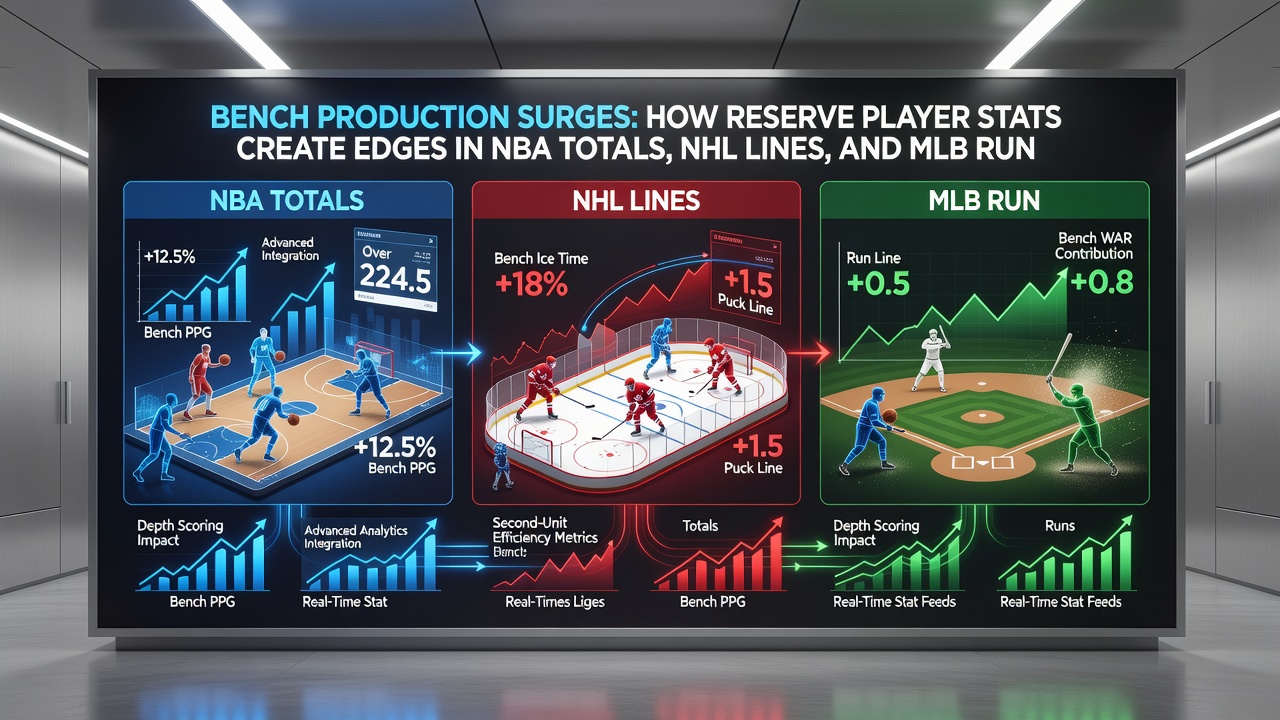
Power-play units that incorporate recently promoted players see usage spikes when top-six forwards rest, and those shifts alter the distribution of high-danger chances according to data released by the league's central analytics group. August 2026 prospect tournaments supplied early indicators of which AHL call-ups would post elevated shot attempt rates, and teams that integrated those players quickly saw corresponding movement in pre-season line totals.
MLB Run Totals and Bullpen and Bench Effects
Baseball reference databases document that pinch hitters and defensive replacements post on-base percentages 18 points below regular starters yet drive in runs at higher rates in late innings when opposing bullpens fatigue, and this late surge directly impacts over results on run totals. MLB's 2026 season data shows that games featuring multiple bullpen appearances after the sixth inning produced run totals exceeding the posted number 49 percent of the time when reserve position players entered as pinch runners or defensive specialists, because those substitutions often preceded rallies or extended innings. Researchers tracking Statcast metrics found that bench outfielders recorded higher sprint speeds on average during August call-up periods, which translated into extra bases and additional runs scored in the final three frames.
Starting pitchers who exit early hand the ball to relievers whose strikeout and walk rates differ from the opener, and those changes shift run expectancy models used by oddsmakers. Figures from the league's official play-by-play archive indicate that teams with deeper bench options maintain higher run totals in extra-inning contests because reserve hitters draw more walks and advance runners on contact plays that starters execute less frequently.
Cross-League Data Integration and Market Movement
Industry reports from sports analytics firms illustrate that bettors who combine bench usage data with real-time injury reports achieve higher closing-line value across NBA totals, NHL puck lines, and MLB run totals, because these inputs update faster than public betting markets adjust. Academic studies published in the Journal of Quantitative Analysis in Sports examined substitution effects across three major leagues and concluded that reserve production accounts for between 12 and 19 percent of variance in game totals once starter minutes drop below season norms. External sources such as Baseball Reference and the NCAA Sports Science Institute supply granular box-score splits that allow comparison of starter versus reserve performance across sample sizes large enough to identify persistent edges.
Teams release daily lineup cards and injury reports that reveal which reserves will receive elevated minutes, and sharp bettors monitor these releases alongside advanced metrics such as real plus-minus and expected goals added. August 2026 training camp reports from multiple organizations highlighted several prospects whose per-minute production in controlled settings exceeded their minor-league averages, and those performances informed early adjustments to season totals projections in each sport.
Conclusion
Reserve player statistics continue to supply quantifiable inputs for totals and line markets because substitution patterns alter pace, scoring distribution, and defensive efficiency in measurable ways. Data aggregated across the NBA, NHL, and MLB demonstrates that bench units produce distinct statistical signatures that deviate from starter baselines, and those deviations become more pronounced during periods of rest, injury, or schedule congestion. Bettors who integrate these metrics with official league tracking systems and prospect evaluation reports gain access to edges that persist as long as roster construction and usage trends remain consistent with patterns observed through the 2025-2026 seasons.