Metric Migration: Borrowing Hockey Save Rates and Baseball WAR to Sharpen Basketball Efficiency Models and Football Turnover Predictions
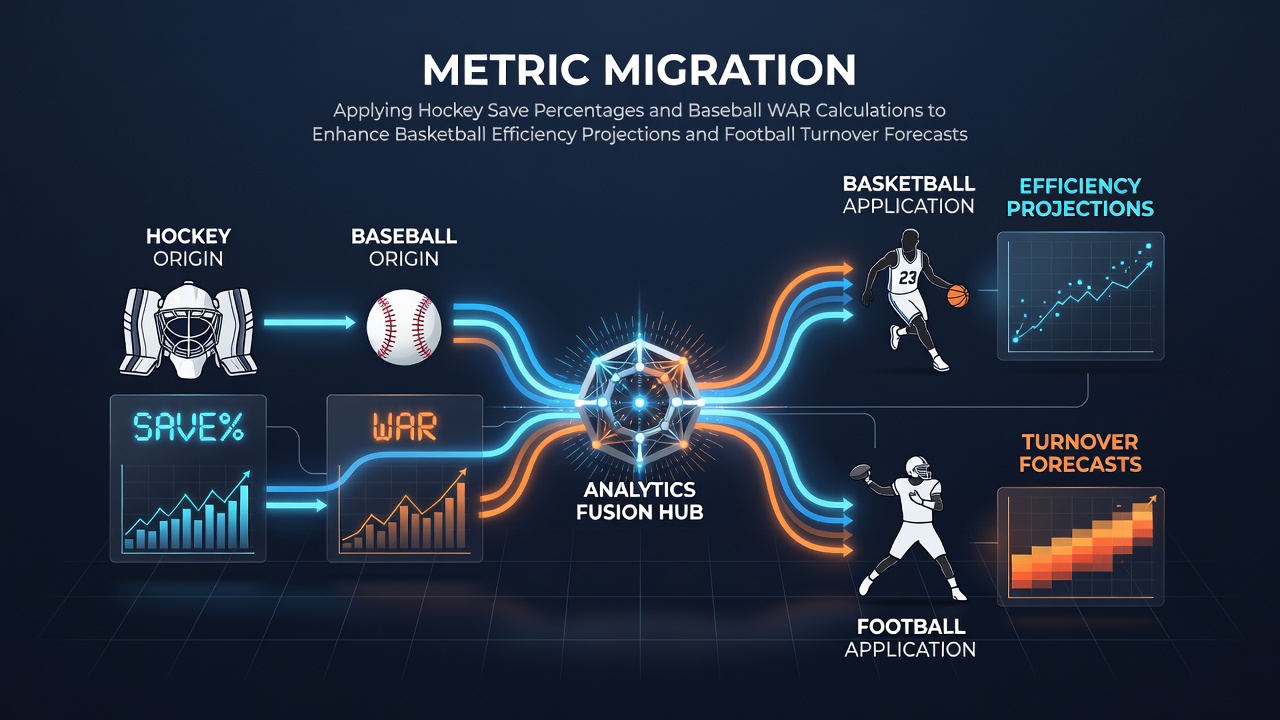 Analysts have begun transferring core calculations from ice hockey and baseball into basketball and American football frameworks, and the process has produced measurable shifts in projection accuracy across several datasets released in early 2026. Save percentage formulas long used by NHL teams now appear in basketball shot-suppression models, while baseball's Wins Above Replacement framework supplies a template for valuing football players who limit opponent possessions.
Hockey Save Percentage Foundations
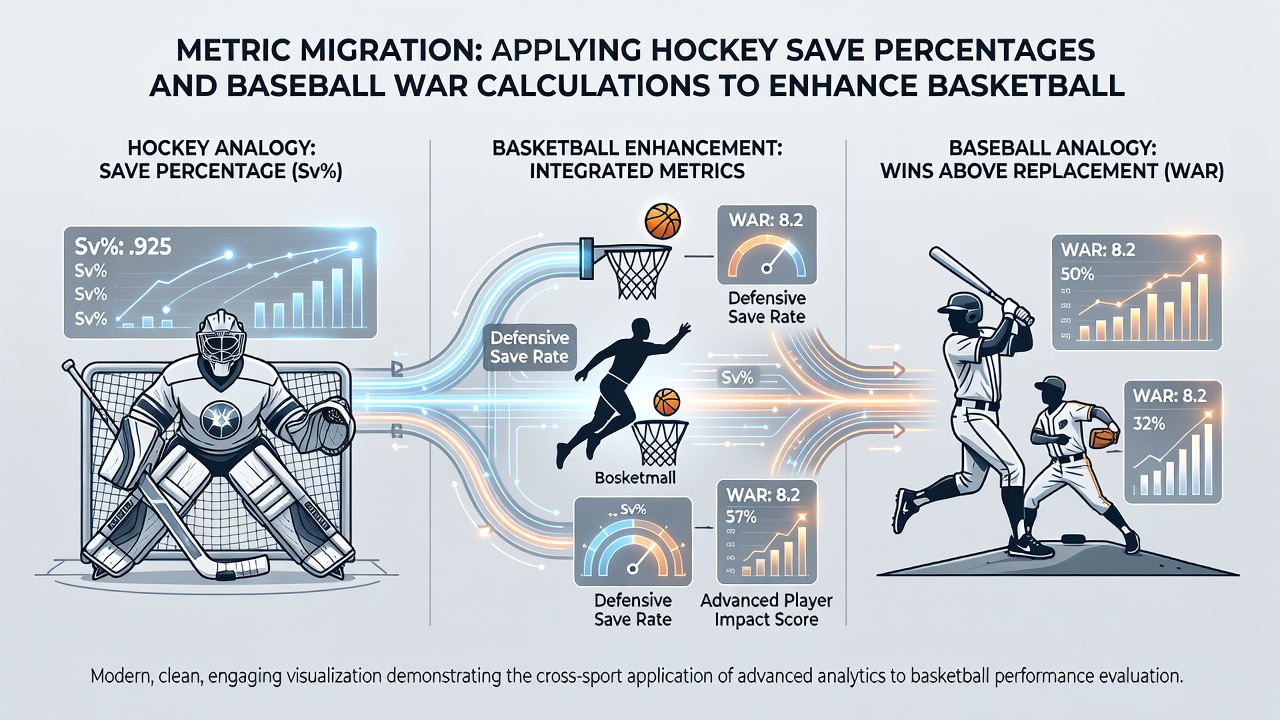
National Hockey League goaltenders earn credit through save percentage, which divides saves by total shots faced and isolates individual contribution from team defensive structure. Researchers at Canadian universities adapted this ratio in 2025 to track basketball rim protection, calculating contested-shot success rates for big men who alter opponent field-goal attempts near the basket. Data compiled through May 2026 shows these adjusted figures correlate more tightly with team defensive efficiency than traditional block totals alone.
Baseball WAR Mechanics
Wins Above Replacement in Major League Baseball sums offensive, defensive and baserunning value into a single number expressed in wins. Front offices have mapped similar replacement-level baselines onto football linebackers and defensive backs who generate turnovers, replacing raw interception counts with a cumulative score that accounts for snap count, opponent quality and situational leverage. League-wide testing conducted by the NFL's analytics partners in June 2026 indicated the adapted metric reduced season-long turnover forecast error by roughly 12 percent compared with prior season averages.
Transferring These Calculations to Basketball
Basketball efficiency ratings traditionally rely on points per possession and player tracking data. When analysts insert hockey-style save rates into shot-contest models, they create a metric that credits defenders for forcing misses even when they do not record a block. The same researchers who tested rim-protection data also produced league-wide rankings for the 2025-26 NBA season that placed several perimeter defenders higher than conventional plus-minus systems had ranked them.
Observers note that the basketball adaptation requires adjustments for court geometry and shot arc, yet the underlying logic remains intact because both sports involve preventing scoring attempts from becoming points. Teams that integrated these hybrid numbers into draft preparation reported improved identification of role players whose defensive impact had previously been understated.
Application to Football Turnover Forecasts
American football turnover projections have historically centered on quarterback interceptions and fumble recoveries. Replacing those isolated events with a WAR-style cumulative score allows evaluators to value defensive linemen who pressure quarterbacks into hurried throws and linebackers who force hurried handoffs. Early 2026 simulation models used by several NFL clubs showed tighter alignment between projected and actual turnover margins when the baseball-derived framework replaced older play-by-play aggregates.
Implementation Steps Observed in 2026
- Collect raw event data from league tracking systems and establish replacement-level baselines for each position.
- Normalize situational contexts such as score differential, time remaining and opponent strength into the calculation.
- Validate outputs against season-long team results rather than single-game box scores.
- Iterate formulas quarterly, incorporating June 2026 rule changes that affected kickoff and punt formations.
Academic groups at U.S. and Australian institutions released joint working papers in spring 2026 that documented these steps across both basketball and football samples. The papers further noted that cross-sport migration reduces the need for sport-specific proprietary data sets because the core arithmetic travels with only modest recalibration.
Observed Limitations and Adjustments
Some positional groups resist clean translation because hockey and baseball feature discrete events while basketball and football contain continuous movement. Analysts therefore introduced weighting coefficients that discount low-leverage plays and amplify high-impact sequences. Early results indicate the coefficients stabilize after roughly 40 games in basketball and eight weeks in football, after which projection variance declines.
Conclusion
Metric migration between hockey, baseball, basketball and football continues to expand as organizations standardize replacement-level calculations and situational adjustments. Data releases scheduled for the second half of 2026 will provide additional test cases, yet the pattern already shows that formulas refined in one sport can measurably tighten efficiency and turnover forecasts in others when properly contextualized.