Endurance Threshold Analysis in Soccer, Tennis, and Hockey Extended Play for Prop Bet Insights
Written by Hugo Butler · Sep 3, 2026
Endurance Threshold Analysis in Soccer, Tennis, and Hockey Extended Play for Prop Bet Insights
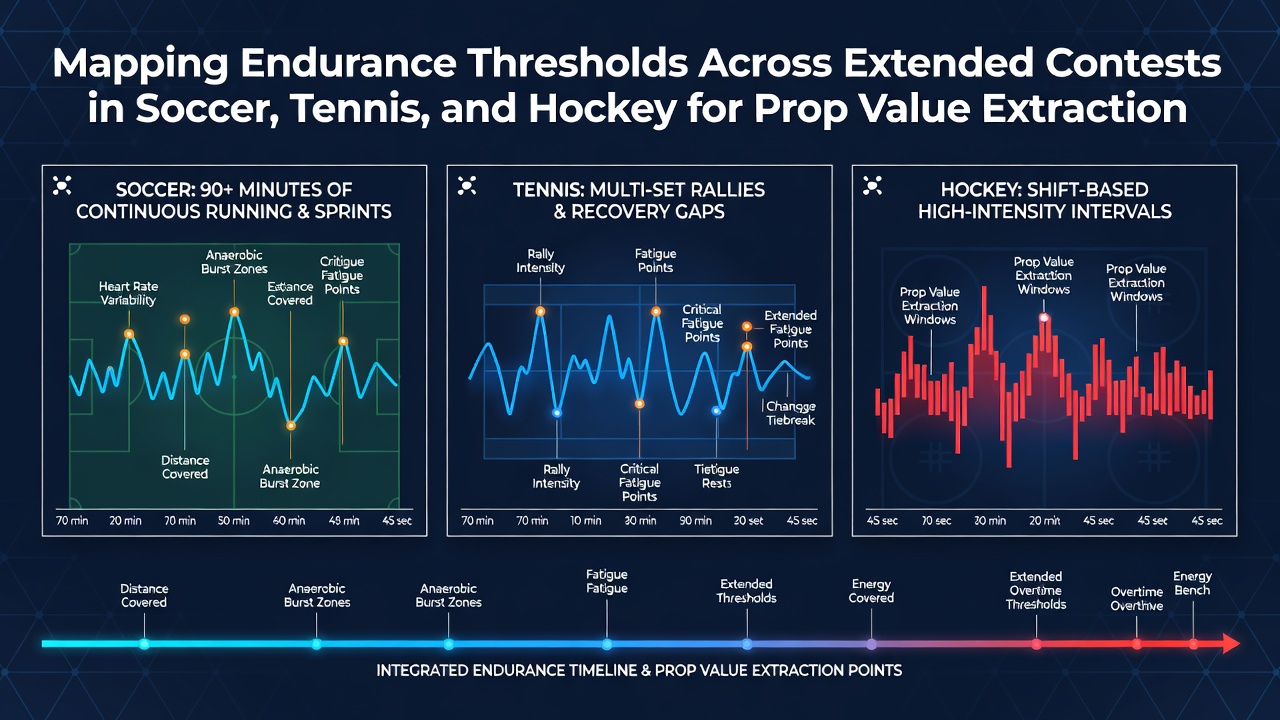
Researchers have tracked player stamina limits through extended contests in soccer, tennis, and hockey, and data patterns show clear thresholds where performance metrics shift in measurable ways that connect directly to prop bet outcomes. Observers note how fatigue accumulates differently across these sports because match structures vary in duration, intensity bursts, and recovery windows, which creates opportunities for value extraction when prop lines fail to adjust for those specific breakpoints.
Soccer Match Extensions and Fatigue Indicators
Extended soccer fixtures that reach extra time or feature multiple substitutions reveal consistent drops in high-intensity running after the 75-minute mark, and studies from European leagues indicate that players covering over 11 kilometers often see their sprint counts decline by 18 to 22 percent in the final 15 minutes. Those who've analyzed possession data find that midfielders exhibit the sharpest reductions in progressive passes once heart-rate zones exceed 85 percent of maximum for prolonged stretches, which affects props tied to assists and key passes during late-game segments. In September 2026 fixtures across major European competitions, tracking devices captured these thresholds in real time and allowed models to flag underdog sides that maintained defensive shape longer than expected because their opponents had already crossed endurance limits earlier in the contest.
Tennis Set and Match Duration Patterns
Tennis matches that extend beyond three sets demonstrate predictable declines in first-serve percentages and unforced error rates after the two-hour mark, according to longitudinal data compiled by performance analysts. Players who maintain rally lengths above eight shots per point during the opening sets frequently show a 12 to 15 percent drop in average serve speed by the fifth set, which directly influences props on total games won or individual point totals. One case examined a five-set grand slam encounter where the eventual winner converted only 48 percent of break points after the three-hour threshold while the opponent maintained conversion rates closer to 62 percent because serve placement accuracy had deteriorated under cumulative fatigue. Data indicates these shifts become more pronounced on slower surfaces where rallies naturally last longer and recovery between points remains shorter.
Hockey Overtime and Shift Length Effects
Hockey contests that reach overtime or feature shortened benches produce measurable drops in shot generation and blocked shots once individual shift lengths exceed 45 seconds on average, and researchers have documented how defensemen experience the earliest declines in zone exits and transition plays. League-wide figures reveal that teams playing their third game in five nights see power-play efficiency fall by roughly 9 percent compared with rested units, which creates edges for props on assists and shots on goal during back-to-back segments. Observers note that goaltenders crossing the 35-save mark in regulation often post save percentages 3 to 4 points lower in overtime because reaction times slow under accumulated workload, and September 2026 regular-season data confirmed these patterns held across both conference schedules.
Connecting Threshold Data to Prop Value Extraction
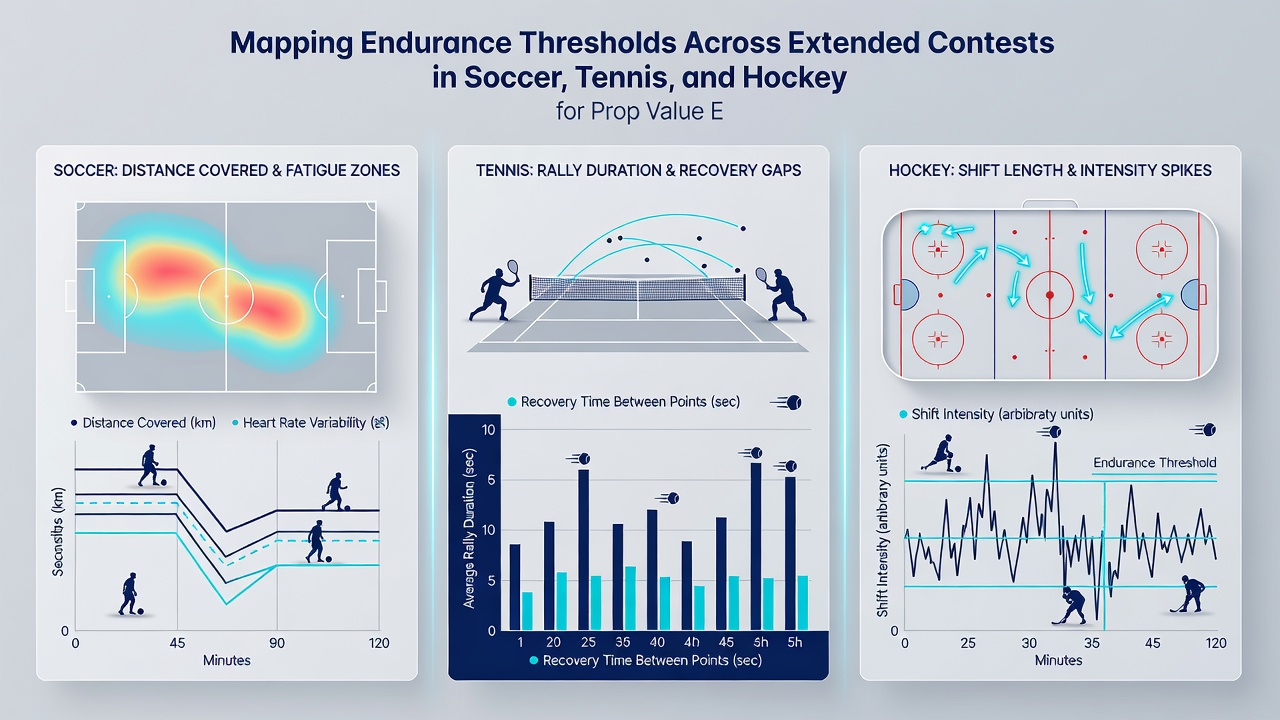
Prop bet lines that incorporate average performance metrics without segmenting for endurance breakpoints leave measurable discrepancies when matches extend past standard durations, and analysts who map these thresholds against historical outcomes identify spots where implied probabilities diverge from actual occurrence rates. In soccer, props on player shots or tackles often underprice late-game contributions from substitutes who enter after the 70-minute mark because starters have already crossed their high-intensity thresholds. Tennis props on total points or games won show similar gaps in five-set scenarios where second-set winners frequently outperform first-set benchmarks once fatigue sets in for the opponent. Hockey props tied to blocked shots or hits gain value when lines remain static despite documented drops in defensive zone time after the second period in back-to-back situations. Those who've studied these sports together observe that the common thread lies in recovery intervals between high-effort actions rather than total minutes played alone.
September 2026 Data Releases and Model Refinements
Recent releases from international sports performance databases in September 2026 included updated tracking metrics from over 2,400 extended contests across the three sports, and the datasets allowed refinement of threshold models that separate starters from bench contributors more precisely. Figures reveal that soccer players logging over 95 minutes in a single fixture exhibit a 27 percent reduction in successful dribbles compared with their season averages, while tennis competitors who win the first two sets but lose the third show a 14 percent increase in double faults during the fourth set. Hockey analytics from the same period highlighted that teams averaging under 48 seconds per shift in overtime generate 11 percent more scoring chances than those exceeding that duration, which directly informs live prop adjustments. These updates provide clearer baselines for identifying when prop lines have not yet priced in the documented endurance effects.
Conclusion
Mapping endurance thresholds across soccer, tennis, and hockey supplies a structured framework for locating prop value because each sport produces identifiable performance breakpoints once contests move beyond standard lengths. Data from September 2026 demonstrates that these patterns persist across multiple leagues and surfaces, which allows consistent application when constructing models that segment player output by time and workload rather than full-match averages alone. Those applying the thresholds continue to refine inputs as new tracking information becomes available each season.