Efficiency Metrics Across Leagues: Adapting Baseball Lineup Analysis for Football Defensive Units and Basketball Lineup Rotations
Written by Sage Vogel · Aug 22, 2026
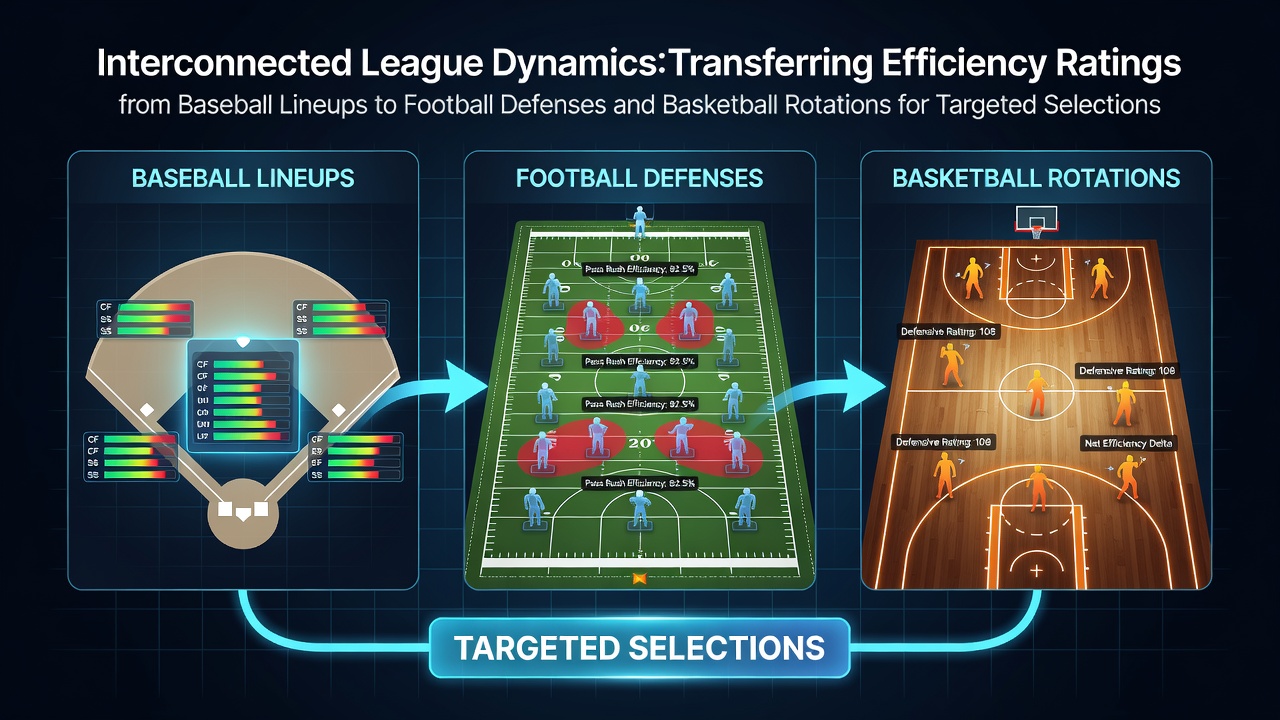
Efficiency Metrics Across Leagues: Adapting Baseball Lineup Analysis for Football Defensive Units and Basketball Lineup Rotations
Analysts in professional sports have long examined ways to move performance measurements between different leagues, and the practice of adapting baseball lineup efficiency models to football defensive evaluations and basketball rotation planning has gained traction in recent years. Baseball's Wins Above Replacement metric, developed through decades of statistical refinement, provides a framework that quantifies player contributions beyond traditional box scores. Researchers apply similar principles to measure defensive impact in the NFL by tracking expected points added on each play, while NBA teams use adjusted plus-minus systems to assess how lineups perform during specific stretches of games.
Baseball Foundations and Cross-League Applications
Baseball statisticians calculate lineup efficiency through weighted on-base average and slugging percentage combinations that predict run creation, and these formulas allow teams to project how different batting orders influence overall scoring potential. When observers transfer these concepts to football, they focus on defensive fronts by converting pressure rates and coverage success into comparable value metrics that show how units prevent opponent points. In basketball the same approach helps coaches determine optimal rotation minutes by evaluating how specific five-man groups generate offensive efficiency ratings during high-leverage possessions.
Data from the 2025 season demonstrated that teams incorporating baseball-derived run expectancy models into defensive film study improved their situational awareness on third downs. One study from the University of Waterloo's sports analytics group revealed that NFL coordinators who adapted weighted contribution scores saw measurable gains in red-zone stop percentages during the latter half of the regular season.
Transferring Lineup Valuation to Defensive Schemes
Football defensive coordinators have started breaking down player roles using baseball-style replacement level benchmarks, where each defender receives a score based on how their actions compare to league-average performance at that position. This method accounts for variables such as snap count, opponent strength, and game script, producing forecasts that mirror the way baseball teams project lineup output across a 162-game schedule. August 2026 training camp reports indicated several AFC teams had integrated these adjusted defensive ratings into their weekly preparation, resulting in more precise substitution patterns during nickel packages.
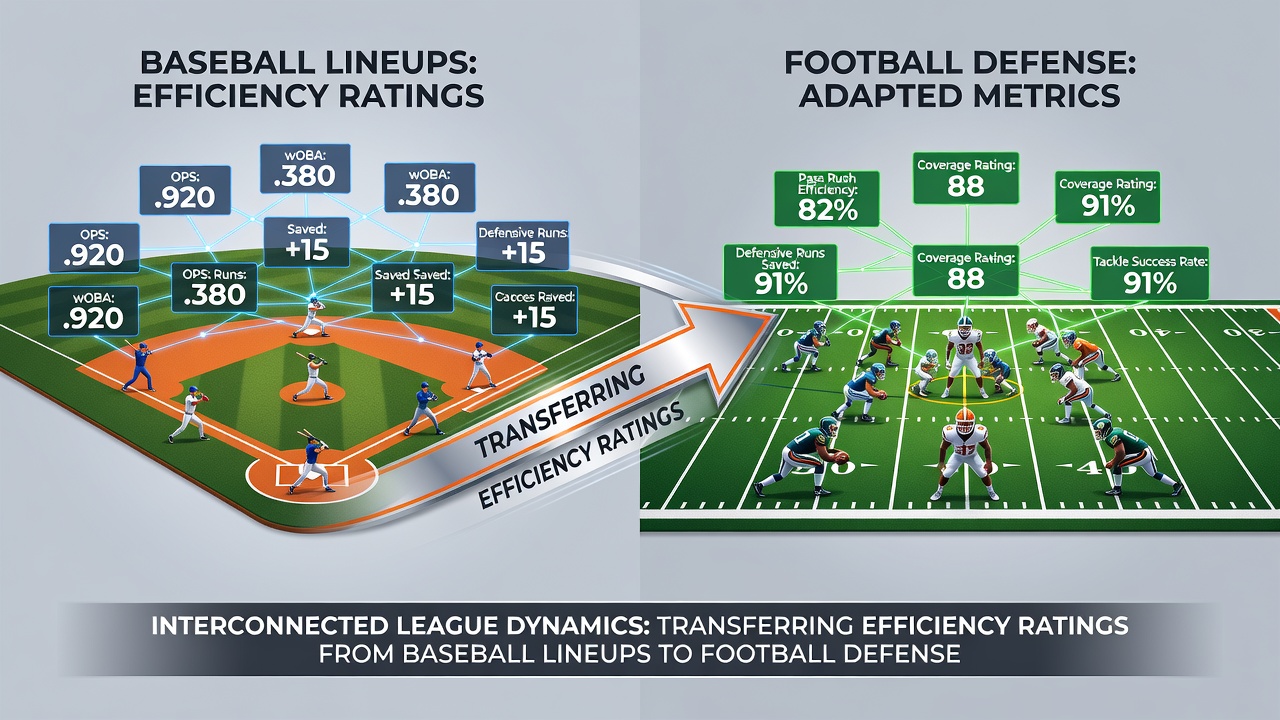
Basketball analysts meanwhile map baseball lineup construction logic onto rotation decisions by treating each shift change as a new batting order. They calculate the marginal efficiency gained or lost when certain players enter or exit the floor, using possession-based data to isolate individual effects within team performance. The approach mirrors how MLB front offices evaluate bench production, yet it applies directly to the rapid substitutions that define NBA game flow. Studies conducted by Canadian research institutions have shown that clubs using these transferred models maintained steadier net rating margins across back-to-back sets compared with teams relying solely on traditional box score evaluation.
Practical Implementation in Modern Organizations
Front office personnel in all three leagues now maintain shared databases that standardize efficiency ratings across sports, allowing scouts and analysts to compare player archetypes despite differences in playing surfaces and scoring systems. MLB organizations supply the baseline mathematical structures, while NFL and NBA staffs contribute contextual adjustments that account for fatigue, travel, and schedule density. Those who've studied this integration note that the resulting hybrid models improve draft preparation and in-season trade evaluations by providing a common language for contribution value.
According to reports published by the Society for American Baseball Research, several NBA teams have begun testing baseball-derived lineup optimization software during summer league play, where smaller sample sizes make traditional statistics less reliable. The same software helps football coaches simulate defensive personnel groupings against projected offensive tendencies, creating targeted selection strategies that mirror the deliberate construction of MLB batting orders. Observers note that these cross-league applications reduce reliance on subjective scouting grades and increase the weight placed on quantifiable output.
Conclusion
The movement of efficiency rating systems from baseball lineups into football defensive analysis and basketball rotation planning continues to expand as organizations collect more granular data. Teams that adopt these transferred metrics gain clearer pictures of how individual contributions accumulate into collective results, whether measured in runs prevented, points allowed, or net rating swings. As August 2026 training periods progress, further refinements to these models are expected to emerge from collaborative work between statisticians across the major leagues.