Consecutive Game Loads Reshape Recovery Timelines in Professional Leagues
Written by Sage Vogel · Aug 11, 2026
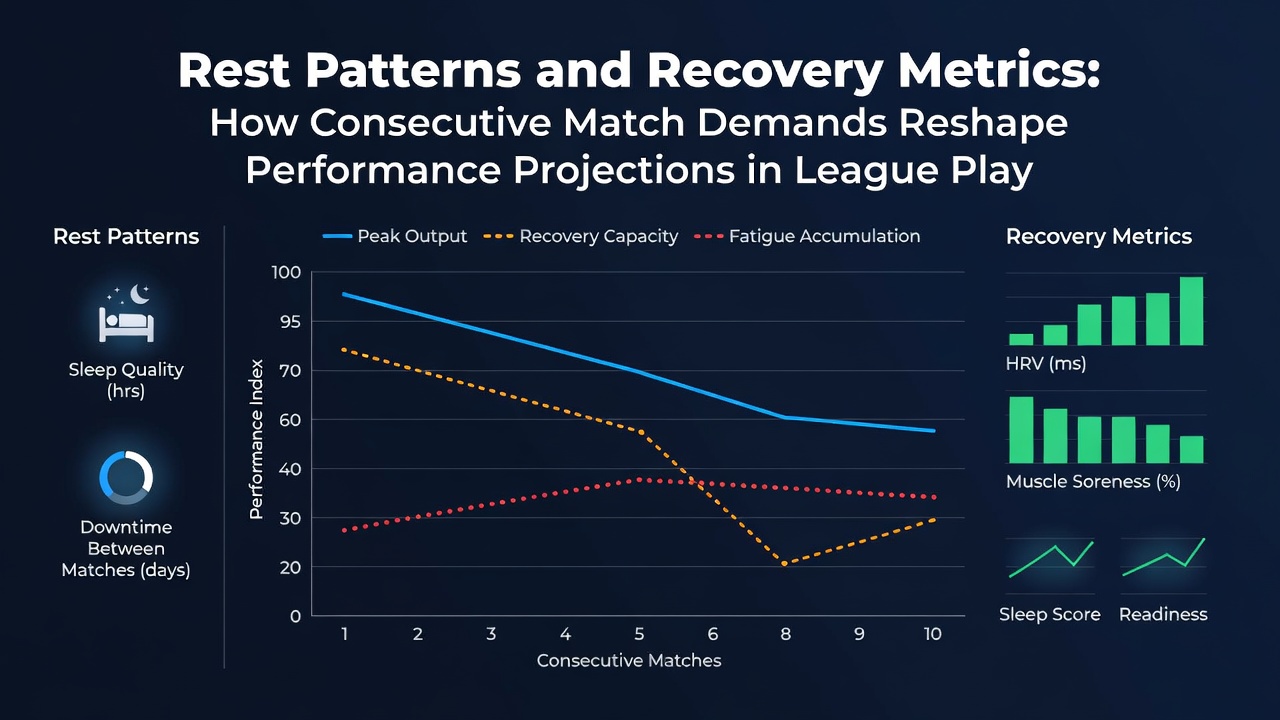
Consecutive Game Loads Reshape Recovery Timelines in Professional Leagues
League schedules pack multiple contests into tight windows, and consecutive match demands alter how players regain strength between outings. Research from sports science programs tracks these patterns through heart rate variability, sleep duration, and movement efficiency data collected across NBA, NHL, and soccer competitions. Figures from the 2025-2026 seasons show that teams with three games in five days record measurable drops in sprint distance covered during later contests, while those granted extra rest days maintain closer to baseline outputs.
Key Metrics That Reveal Recovery Shifts
Performance analysts monitor several indicators when schedules compress. Sleep tracking devices capture total hours and quality scores, while GPS units log total distance, high-intensity efforts, and acceleration counts. Blood markers for creatine kinase rise after heavy loads, and neuromuscular tests such as countermovement jumps quantify power retention. Data collected during August 2026 preseason camps indicated that athletes who averaged under seven hours of sleep across back-to-back periods exhibited slower reaction times in subsequent drills. These measurements feed into projection models that adjust expected performance when calendars show limited recovery windows.
Patterns Across Major Leagues
NBA schedules feature the highest volume of back-to-backs, and league-wide tracking reveals consistent second-game declines in shooting percentage and defensive efficiency. NHL teams traveling across time zones after consecutive road games post lower save percentages for goaltenders and reduced shot generation for skaters. Soccer leagues in Europe and South America document possession retention falling when clubs play midweek cup ties followed by weekend league matches. One study from the Australian Institute of Sport linked four consecutive high-load days to elevated injury risk in the following fortnight, prompting schedule adjustments in domestic competitions. Observers note that these league-specific responses guide how front offices build depth charts and plan training loads.
Adjusting Projections With Schedule Context
Statistical models now incorporate rest metrics alongside traditional box-score inputs. When consecutive match counts rise, expected value calculations shift for player props tied to points, assists, or goals. Researchers at the University of British Columbia examined five seasons of NHL data and found that defensemen logging heavy minutes in back-to-back sets underperformed their season averages by measurable margins in blocked shots and takeaway rates. Similar adjustments appear in NBA lineup forecasts, where minutes restrictions for veterans increase after dense stretches. These updated projections help teams and analysts refine expectations rather than relying on season-long averages alone.

Case Examples From Recent Seasons
During the 2025-2026 campaign, several clubs navigated compressed calendars after weather delays or international breaks. One NBA Eastern Conference squad played five games in eight days and saw its starting backcourt post reduced three-point volume in the final two contests. In the Premier League, a mid-table side faced three matches inside six days and recorded fewer progressive passes per 90 minutes across that window. NHL Pacific Division teams crossing multiple time zones for consecutive road contests showed elevated penalty minutes in later games, reflecting fatigue-related discipline lapses. Each instance supplied fresh data points that refined recovery algorithms used by performance staffs.
Emerging Tools and Data Sources
Wearable technology now streams real-time recovery scores to coaching apps, allowing load management decisions before games tip off. Academic partnerships supply peer-reviewed benchmarks, such as those published in the Journal of Sports Sciences, that validate threshold values for rest needs. Government-supported research initiatives in Canada and Australia continue to expand datasets on youth-to-professional transitions, revealing how early exposure to dense schedules influences long-term resilience. These combined inputs create more granular forecasts that account for both individual recovery profiles and collective team demands.
Conclusion
Rest patterns and recovery metrics now sit at the center of performance analysis across professional leagues. Consecutive match demands produce measurable changes in speed, accuracy, and decision-making that projection systems must incorporate. Data collected through the 2025-2026 period, including observations from August 2026 training blocks, continues to sharpen these models. Teams that integrate sleep, movement, and biomarker tracking gain clearer pictures of how schedule density reshapes output expectations over the course of a season.