Consecutive Contest Challenges: How Recovery Varies Across Hockey and Basketball Calendars
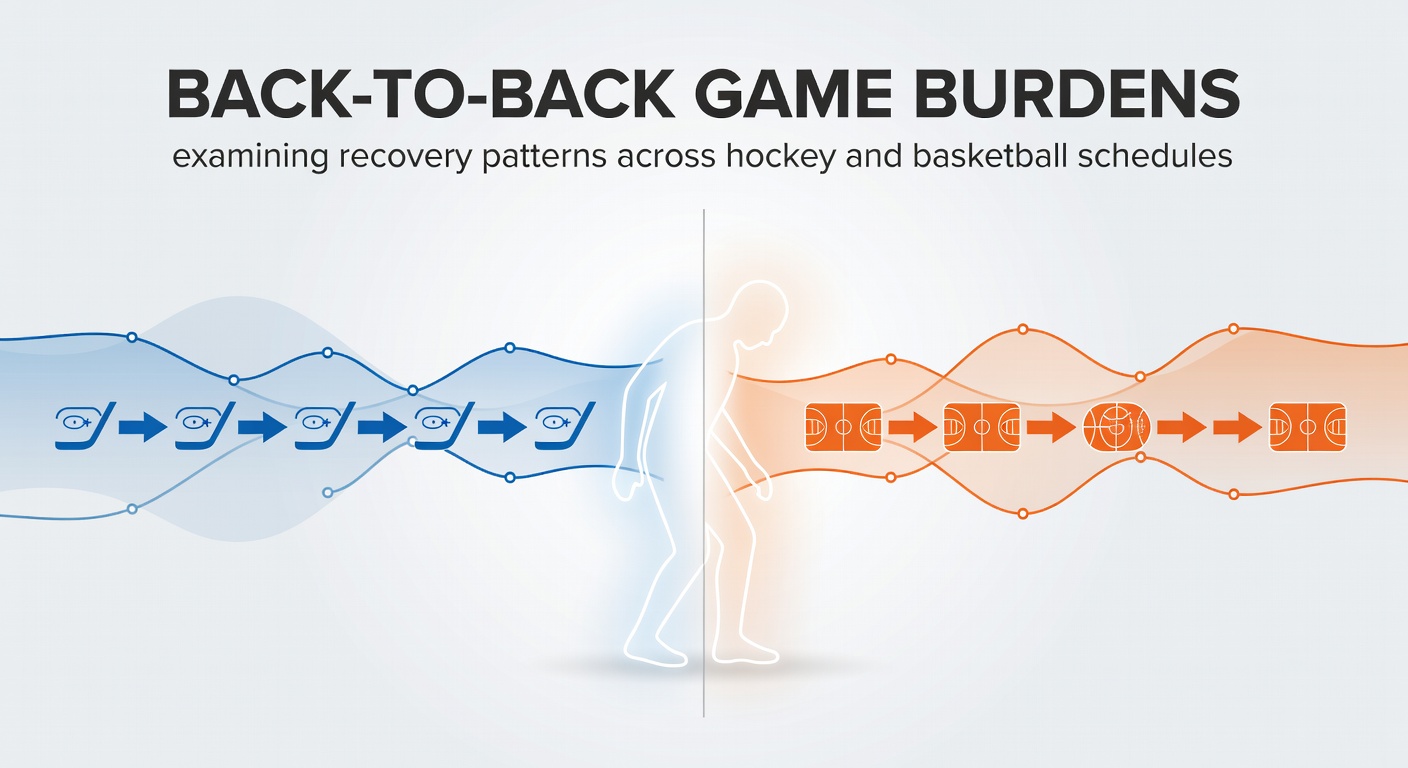
Back-to-back games create distinct recovery demands in professional hockey and basketball where teams often play on consecutive nights and travel adds further strain; data from league schedules shows these patterns affect player availability and performance metrics across entire seasons. Researchers track rest intervals closely because compressed calendars leave limited time for physiological restoration between contests.
Schedule Structures in Major Leagues
NHL teams navigate 82-game seasons with frequent back-to-backs while NBA squads face similar loads in their 82-game campaigns yet encounter different travel and venue factors; league data indicates both organizations cluster games in ways that create recovery windows varying from 24 hours to several days. Observers note that NHL clubs log more cross-country flights due to geographic spread whereas NBA teams concentrate games in regional divisions that sometimes reduce overnight travel but increase game density in short stretches.
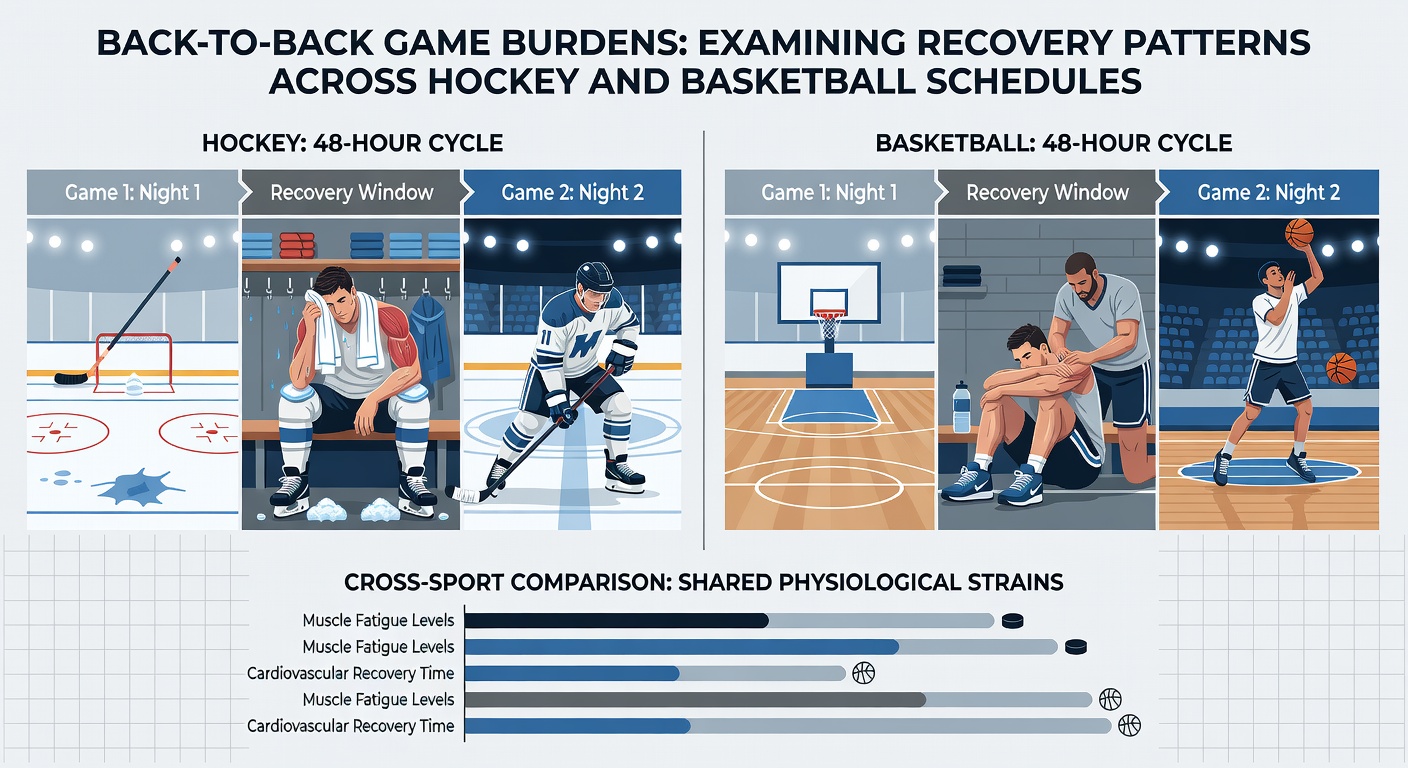
Physiological Responses to Limited Rest
Studies on athlete recovery reveal that muscle glycogen replenishment and sleep cycles suffer measurable declines after consecutive games and blood markers for inflammation rise in patterns documented by sports science teams. Hockey players experience additional impact from physical contact while basketball athletes contend with repetitive high-intensity movements that tax joints and cardiovascular systems; figures from performance tracking systems show average speed and shot accuracy dip in the second game of back-to-backs across both sports.
Travel and Environmental Variables
Distance covered between venues influences recovery timelines because time zone shifts disrupt circadian rhythms and airport logistics compress sleep opportunities; NHL data highlights longer average trips compared with NBA routes yet both leagues report elevated fatigue scores when games occur in successive cities. Environmental conditions such as arena humidity and ice quality in hockey further modulate how quickly players regain baseline readiness while basketball surfaces present consistent court variables that still compound with cumulative minutes played.
Performance analysts compile box score data that links reduced rest to higher turnover rates and lower defensive efficiency and these trends appear consistently when teams play multiple back-to-backs within a seven-day span. June 2026 schedules already reflect adjustments by league offices seeking to balance competitive equity with player health metrics gathered from prior seasons.
Comparative Recovery Patterns
Evidence from season-long monitoring programs shows hockey teams utilize shorter shift lengths and line rotations to mitigate fatigue whereas basketball rotations emphasize bench depth and substitution timing to maintain output; both approaches yield measurable differences in injury incidence rates when back-to-back frequency increases. Data indicates NBA squads sometimes schedule optional shootarounds on off days while NHL clubs prioritize active recovery skates that keep players moving without high exertion loads.
League reports document that recovery protocols incorporate nutrition timing, cold therapy, and sleep tracking devices yet outcomes vary by individual player age and position demands; younger athletes often rebound faster according to longitudinal studies while veterans accumulate wear that compounds across packed calendars. Those who have examined multi-year datasets observe that teams with superior medical staffs reduce the performance drop-off associated with consecutive games through tailored interventions.
Injury and Availability Trends
Medical staff records reveal elevated soft tissue injury risks following back-to-backs and league-wide statistics track games missed due to load management decisions that teams implement to preserve roster health for later schedule stretches. Hockey defensemen and basketball big men appear particularly susceptible in aggregated data while forward and guard positions show different vulnerability profiles tied to movement patterns unique to each sport.
Research institutions have published findings on workload metrics that help coaching staffs predict when recovery deficits may affect game outcomes and these tools integrate heart rate variability readings alongside subjective wellness surveys. External sources such as sports medicine reviews and league performance summaries provide ongoing context for how these patterns evolve year to year.
Strategic Adjustments by Teams
Coaching staffs adjust lineups and minute distributions based on upcoming back-to-back clusters and advanced analytics platforms flag potential dips in efficiency that prompt earlier substitutions; hockey clubs sometimes rest key penalty killers while basketball teams limit starter minutes during the first game of a pair. These decisions reflect data-driven approaches that balance immediate results against longer-term roster sustainability across demanding months.
Conclusion
Recovery patterns in hockey and basketball schedules demonstrate clear links between back-to-back frequency, travel demands, and measurable performance indicators and league offices continue refining calendars using health and availability data. Continued monitoring through June 2026 and beyond will show whether current interventions narrow the gaps that arise when rest windows shrink.